Preparation
Before reading this page you will need to have a copy of the training almanac and chart (and a real one if possible).
You will need to be competent in your understanding of the basics of the tide and height definitions.
Why is this important?
If you had to publish an almanac which contained every tide table, it would be ten times as big – and almanacs are already very big books. Therefore the coast contains a series of “standard ports” and the other ports’ (secondary ports) tide times and heights can be calculated using adjustments from these standard ports.
Calculations
Introduction
To help you with your calculations you may wish to use this worksheet which we refer to below: Secondary Port Calculations Worksheet
Each secondary port will have a table which describes the difference between the standard port and the secondary port.
The first thing to look for is the note at the top of the table which tells you the standard port the table refers to (A). There is also an arrow to show you which way in the almanac to turn.
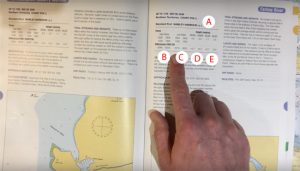
There are four sections of the table.
– High water time adjustments (B);
– Low water time adjustments (C);
– High water height adjustments (D);
– Low water height adjustments (E).
The next step is to copy down the tidal information for the standard port for the relevant date (F). This can be copied into the table at the top left of the worksheet (G).
Note: you should copy the data as it is written in the almanac and not make any adjustment at this time for daylight saving time (if appropriate) this is done later.

The video below summarises these points.
Video: skill
High Water Times
We are now going to make the adjustments from the standard port high water times to the secondary port high water times.
First, we copy the first section of the table (H) made up of two columns onto the worksheet (I).
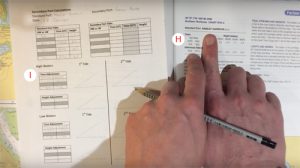
In this case, the data on the table reads:
High water
0000 0600
1200 1800
Differences
-0040 -0018
The first column translates to: if high water at the standard port is at 00:00 (midnight) or 12:00 (midday), the high water time at the secondary port will be 40 minutes earlier.
The second column translates to: if high water at the standard port is at 06:00 or 18:00, the high water time at the secondary port will be 18 minutes earlier.
Note: the format used for time differences if hh:mm therefore -0110 would refer to 1 hour and 10 minutes (not 110 minutes).
In most cases, the high water time will fall somewhere between these times given in the table. For these cases, there are a number of ways to calculate the difference – one method is explained below.

First take the standard port high water time (in this case 08:54) and notice it is between 06:00 and 12:00. We therefore, put “06” (standing for 06:00) on on the upper scale of the triangle at point J and “12” (standing for 12:00) at point K. We fill in the gap between with the intermediate hours.
We note that the time difference at 06:00 would be -18 and therefore write this on the left end of the lower scale (L) and the 12:00 difference of -40 at the right end (M). We complete the scale between these two numbers on the lower scale.
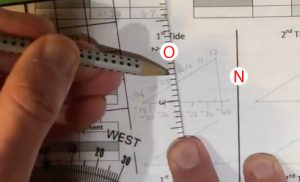
Using a straight edge we draw a line between the two numbers at the right of the triangle (N). We then move the straight edge to the left, keeping it parallel to this line.
We stop when we are in line with the high water time on the top scale (08:54 in this case).
We then read off the time adjustment on the lower scale (in this case -28 minutes).
The secondary port high water time is therefore calculated by adding or subtracting this difference.
In this case: 08:54 subtract 28 minutes gives us 08:26
The video below summarises this method.
Video: skill
Low Water Times
The method for working out low water times is the same as for high water time.
Remember however to use the data in the second section of the secondary port table (P). This can be copied onto the worksheet (Q).
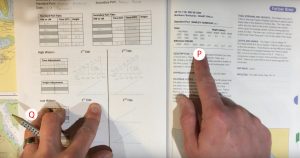
The video below summarises this method.
Video: skill
High Water Heights
To calculate the high water heights we use the third second of the secondary port table (R). We can copy this onto the worksheet (S).

In this case, the data on the table reads:
Heights (meters)
MHWS MHWN
4.0 3.4
+0.7 +0.3
This translate to: is the high water height of the standard port is 4.0m then add 0.7m or if it is 3.4m then add 0.3m.
Again there are a number of ways of working out the difference is the high water height is between these two values. We will use a similar method to the one used for the times.

We write the tidal heights on the upper scale 4.0 at the left end (T) and 3.4 at the right (U). The corresponding differences are then put on the lower scale. +0.7 on the left (V) and +0.3 on the right (W).
You then fill in the numbers in between on both scales.
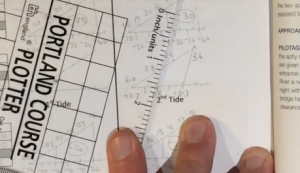
We join the two numbers at the right end of the two scale together with a straight line. Holding the straight-edge parallel to this line we move across the scale until we get to today’s high water height (in this case 3.7).
We then read the adjustment from the lower scale (in this case +0.5).
In this example, the high water height is calculated as 3.7m add 0.5m equals 4.2m.
The video below summarises this method.
Video: skill
Low Water Heights
The method for low water heights is the same as for high water heights. You will however, need to use the fourth and final section of the secondary port table (X). This can be copied onto the worksheet (Y).
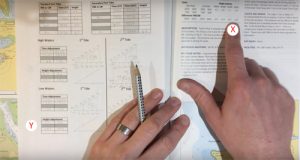
The video below summarises this method.
Video: skill
Shortcuts
Internet
If you are within reach of an internet connection you can very quickly find the tide times and heights of most ports without the need to do the above calculations. One of the best websites is Easytide – play around with the website and explore different tidal curves around the world.
Chart Plotter
Many chart plotters allow you to access tidal information for each port without any further calculations. Some will even change the charted heights on the chart to real time, real depths.
Video: additional information
Links
Easytide – find the tide time, heights and tidal curve for thousands of locations around the world.
Progression
Now that you understand these topics you are ready to find tidal heights for any secondary port. In most cases, you can use the standard port’s tidal curve for the secondary port tidal height calculations.
Feedback
The content of these pages is put together in good faith and is constantly evolving. It is possible that errors exist within this content. If you spot an error or would like to add anything to these pages please contact use via email.
Reading the content of these pages is not a substitute for completing a RYA Shorebased course or similar.
