
Datums & Height Definitions
Preparation
Before reading this page you may wish to read and the basics or reading a chart.
Why is this important?
To be able to calculate tidal heights, the height a lighthouse is above the water or the clearance under a bridge you need to know how these levels are referred to on the chart.
Chart Datum
The depth of water at sea varies constantly with the tide. Therefore the depths on the chart are not the depths you should necessarily expect to find at any given time. The depths on the chart in fact refer to a imaginary level know as chart datum.
As a rule of thumb, Chart Datum is normally the lowest you would expect the tide to fall at any given location however this is not always the case.
Key abbreviations
Mean High Water Springs: MHWS
Mean High Water Neaps: MHWN
Mean Low Water Neaps: MLWN
Mean Low Water Springs: MLWS
Heights and depths from Chart Datum
Firstly it is worth noting that all height measurements on UK charts are in metres, this is not the case in all parts of the world ie. the USA.
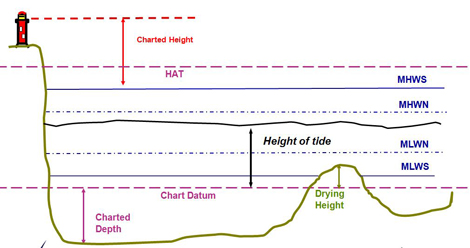
Chart Datum is marked on the diagram below as a purple dotted line and as you can see it is used both:
– for charted depths where the seabed is below Chart Datum;
– and Drying Heights were the seabed is above Chart Datum but that covers at Mean High Water Springs (MHWS).
If you know the height of tide at a given time and location this will be the height above Chart Datum. You can find out more about finding tidal heights on our Tidal Heights page.
Heights on land
Most of the heights of objects on land (above the MHWS line) are measures from MHWS (shown in red on the diagram above).
So for example heights, contours and the height of lights (for example lighthouses) are measures for MHWS.
Clearance under objects
On older charts the clearance under objects is given from MHWS, this is not the case with new charts which refer to Highest Astronomical Tide (HAT), marked in purple on the diagram above.
HAT; the name suggests is the highest the tide would be expected to reach under normal conditions ie. not taking into account air pressure or wind.
You can find the height of HAT above Chart Datum for standard ports on a table of levels on your chart (see example below with HAT in the fourth column).

Links
Chart Datum (Wikipeadia)
More detail on Chart Datum
Check your understanding

Check your knowledge of the basics using this quick self-marking test.
Open the quiz
Progression
If you understand the topics on this page you can now go on to calculate tidal heights.
Feedback
The content of these pages is put together in good faith and is constantly evolving. It is possible that errors exist within this content. If you spot an error or would like to add anything to these pages please contact use via email.
Reading the content of these pages is not a substitute for completing a RYA Shorebased course or similar.
