Preparation
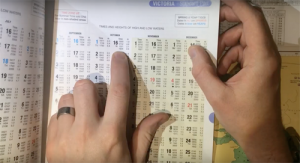
Before reading this page you may wish to read up on time zones and grab a copy of the training almanac (and a real one if possible).
You will need an understanding the Chart Datum before reading this page.
Why is this important?
If you are entering a harbour or crossing a bar you need to know there is enough water so that you don’t go ground.
If you are mooring up to the night you will need to make sure you don’t go aground, or if you do go aground when you will and when your float off.
Does the height of tide really change?
In some part of the world the height of the waters surface hardly changes [Easy Tide – Nice, French Mediterranean Coast] and it you have always lived in one of these regions this page will seam pointless.
However, in other parts of the world, the tide changes rapidly and dramatically throughout the day [Easy Tide – Tancarville, French Atlantic Coast].
Most places in the world will fall somewhere between these two extremes.
Watch this video that shows you the tide coming in at the Bay of Fungy, Canada.
Video: additional information
What causes the tide?
This video gives you a little bit of background information about the causes of tide.
Video: additional information
Setting up the tidal curve
The tide table gives us the tide times and heights at high water (HW) and low water (LW). To find the heights at times between we need to set up a tidal curve.
The curve will normally be centred around the high water time, however look out for curves that are centred around the low water time. The method is the same for both however you should use the appropriate high or low water time.
The curve will normally be made up of two curves, commonly coloured:
– blue for neaps;
– red for springs.
The first thing to do is to find the tide times for the appropriate port. It is best to write these down on a separate sheet of paper so you don’t need to keep referring back to them (remember to adjust for summer time if appropriate).

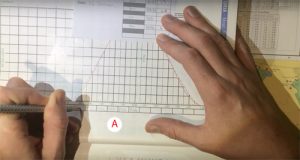
We then mark up the times of high water at the centre bottom of the tidal curve (Point A). Remember for some ports this will be the low water time in the centre.
You then mark the times each hour before and after high water.

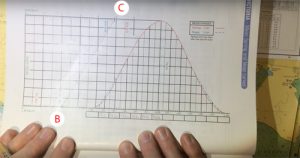
We now need to set up the left-hand side of the tidal graph. Here we mark the low water heights on the bottom scale (Point B) and the high water height on the top scale (Point C).
We then join these two marks with a straight line.

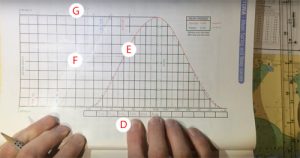
To find a tidal height at a set time we find the time we are interested in on the time scale (Point D). We go straight up to the tidal curve (Point E)*, then across to your straight line joining the high and low water heights (Point F).
Finally, you go either up or down to the height scale (in this case up to Point G).
At this scale, you now read the height off.

* You can establish which curve to use by calculating the tidal range (high water height subtract low water height) and compare this to the neap and spring ranges in the top right of the tidal curve page. If the range on a particular day is closest to the spring range use the spring curve and vice-versa.
The video below talks you through the whole process from above.
Video: skill
When will there be enough water to cross a charted area
Imagine you need to cross over a shallow stretch of water. At sometimes the water may be too shallow to cross. You can use the tidal curve to calculate when there is likely to be enough water to safely cross a particular area.
This Tidal Calculations Sheet may help you when doing this calculation.
Note: In all of the examples below we allow a “clearance” which is our safety margin. The amount you leave will depend on a number of factors including:
– how accurate the chart survey is.
– what is making up the seabed ie. sand is more likely to move around than rock.
– weather and sea condition.
Video: skill
Finding a safe depth when anchoring
When you come to anchor you may have a different problem. You need to know what depth of water you should anchor in now in order for there to be still enough water for you to float at low water. You, therefore, need to calculate how much the tide will fall between now and low water.
This Tidal Calculations Sheet may help you when doing this calculation.
You might ask: why not just find the correct depth of water on the chart, allow for tide at low water and then go there. This would be good in planning where to anchor however does not allow for the chart depth data being either out of date due to a recent shifting sand bar or a survey that was done many years ago (commonly over 100 years in some areas) which may be lacking detail. We therefore often find ourselves in a position where the only accurity information in the depth of water now and the tidal times and heights. This is the problem we look at here.
Video: skill
Tides
Links
Sail Train: Tidal Height
This is a link to a number of tidal height questions with explanations.
UKHO – Easy Tide
Use the Easy Tide website to investigate how tides differ around the world.
RYA: Top Tips
See the RYA Top Tips of calculating Tides
Check your understanding

Check your knowledge of the basics using this quick self-marking test.
Open the quiz
Progression
If you feel you understand the above topics you should practise finding the tidal height at any time.
Make sure you understand how to calculate if you have enough water to stay floating at low tide when you moor or anchor your boat in tidal waters.
Feedback
The content of these pages is put together in good faith and is constantly evolving. It is possible that errors exist within this content. If you spot an error or would like to add anything to these pages please contact use via email.
Reading the content of these pages is not a substitute for completing a RYA Shorebased course or similar.
