Preparation
Before reading this page you may wish to read up on time zones and grab a copy of the training almanac (and a real one if possible).
Why is this important?
When calculating your position taking account of tide we allow your position to be known more accurately. If you want to know which way to point your boat in order to get to the destination you need to take account of tide to stop you being pushed off course.
Can we see these tidal streams?
Much of the time when you are on open water there will be no visual clues to the direction of the tide (particularly when the wind in light). It is the effect that this tidal stream has on the waters surface which you might notice.
Anchored objects
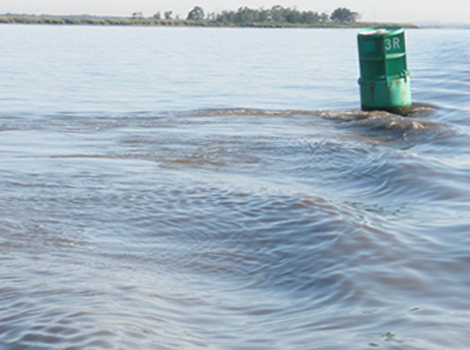
The simplest way is to pass close (but safely) by an anchored object. In the picture below you can see the tide acting on a buoy with the tide flowing towards the bottom left of the photo. This technique is useful to confirm that the tide is doing what you expect.
Headlands and shallows
Even in areas there is little tidal flow you may see acceleration of tidal flow at ‘pinch points’. This might be a headland where the water in forced out and around or an area of shallow water where water is forced up to travel over a relatively shallow stretch of sea bed. Think of these as like pinching the end of a hole pipe – the same amount of water is flowing so it has to accelerate.
A particularly famous example of these is the stretch of water just south of the Bill of Portland, Dorset, England (see the map below) where the tidal stream of the English Channel has to divert around the large land mass of Portland and is then also confronted by a relatively shallow area of sea bed – ‘The Shambles’.
Visit YR.com for a view of the tidal currents around the UK.
Wind against tide
The wind and tidal stream can also work together to effect the appearance and effect of the water around you. Basically if the tidal and wind are heading in the same direction the sea state will be not as rough as if the wind and tide are heading in opposite directions.
This is something to be very aware of when you are on passage as a relatively calm stretch of water can be transformed by a change in the tidal stream direction.
How do we know which direction the tide in flowing?
In general the tidal streams that we experience follow the same 12ish hour cycle as the tidal heights. ie they repeat every 12 and a bit hours. How the tidal streams vary over these 12 hours very much depends on the geography of the land and the seabed around where you are passing.
There are two methods for finding the tidal stream direction and speed.
Tidal Stream – using a Tidal Atlas
The tidal stream atlas is a quick and visual way of getting a good understanding of the tidal stream in the area of water you are passing through.
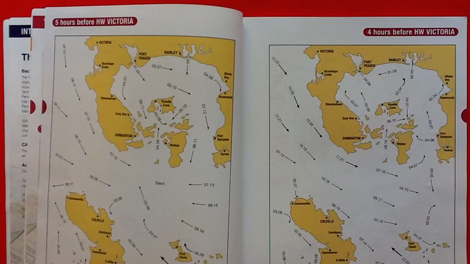
Below is a picture of the RYA Training Almanac that show two pages of the 13 pages of this particular tidal stream atlas. They will normal have 13 pages, each page being a snap shot of what you could expect the tidal streams to be doing each hour between 6 hours before high water and 6 hours after high water.
It is important to note that that it does not matter where you are current positioned on the chart, if you are using a tidal stream atlas, all times refer to the Standard Port shown (in this case VICTORIA) at the top of the page.
As well as getting a good overview of the tidal stream from these diagrams you can also read off precise information about the tidal stream direction and speed.
Each arrow on the chart can have its direction measured, using a plotting, to establish the direction of tidal at time position at that point in time.
You can see in the picture below the top edge of the Portland Plotter being lined up with arrow in the centre of the right-hand page. You then line up the north (N) on the bezel of the plotting with the top of the pages using the grid lines lined up with the edge (or top) of the page.
Remove the plotted from the page and read off the ‘true’ direction of the tidal stream.
You will then notice that each arrow has two numbers next to it divided by what looks like a decimal place, for example ‘07.16’.
The dot is not a decimal place but is used in this case to divide two numbers – the spring and neap rates of tide. In the example above 07.16 become 0.7kt at neaps and 1.6kt at springs.
So you can see:
– 10.19 becomes 1.0kt at neaps and 1.9kt at springs
– 07.14 becomes 0.7kt at neaps and 1.4kt at springs
– 03.05 becomes 0.3kt at neaps and 0.5kt at springs
We will look at finding the actual rate of tide later.
To see the whole method explained watch this video.
Video: skill
Tidal data from the chart (Tidal Diamonds)

The second method we will look at for obtaining tidal stream information comes straight from the chart.
At particular positions on most charts you will find Tidal Diamonds. The symbol is a magenta or blue rhombus with a identifying letter in the centre – these are know as tidal diamonds.
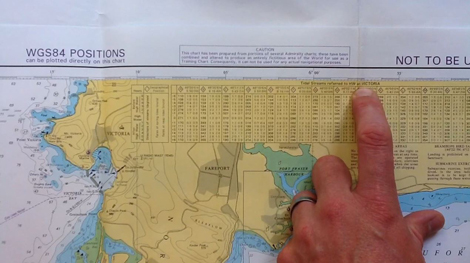
Once you have identified which tidal diamond you are interested in (normally, but not always the one closest to you) you can refer to the table at the side of the chart (on RYA training chart 3 it can be found at the top of the chart as in the picture below).
Just like the tidal stream atlas all of these tidal diamonds refer to one high water time. In this case it is Victoria, you can see this information written at the top centre of the table (where the finger is pointing).
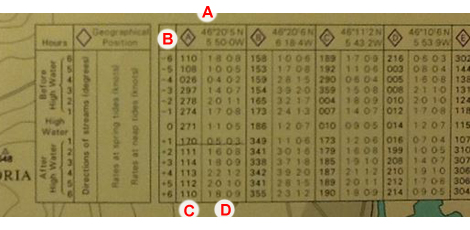
Now if we take a closer look at the table you can see there is a section for each tidal diamond, point A on the picture shows the section from tidal diamond A.
To the left of these sections is a set of numbers which run from -6 to +6 (point B) which represent each hour from 6 hours before high water (-6) through high water (0), down to 6 hours after high water (+6).
The first column in each section shows the tidal stream direction (point C) and the two columns after this show the spring followed by the neap rate (point D).
So for example if you need to know the tidal stream 1 hour after high water (Victoria) at tidal diamond A (underlined). You can see this would be:
– 170o(T), spring rate 0.5kt, neap rate 0.3kt.
Again we will look at finding the actual rate of tide later.
If you look carefully you will often see that the tidal diamonds and arrows on the tidal stream atlas at in the same places. This is because they generally use the same data, just displayed in a different way.
To see the whole method explained watch this video.
Video: skill
Calculating the tidal hour
It may help to print a few copies of the Tidal Hour worksheet below before starting this exercise. It is possible to draw your own however and you will be expected to do this in the exam.
Tidal Hour Sheet
Use this sheet to practise finding the correct tidal hour.
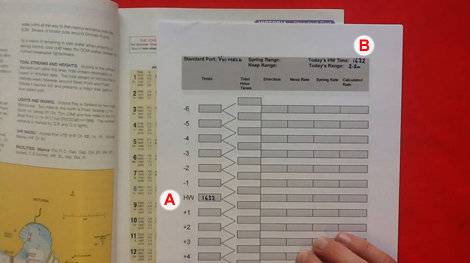
The first step is to find the high water time for the standard port (in this case Victoria) on the day in question. There are two high waters each 24 hours (at least there are in these examples) so use the high water time closest to the time of your passage.
Put the high water time in the spaces provided on the sheet (points A and B). In this case high water Victoria was at 1632.
Note: if this tide time was in the unshaded section of the tide table we would have had to add an hour.
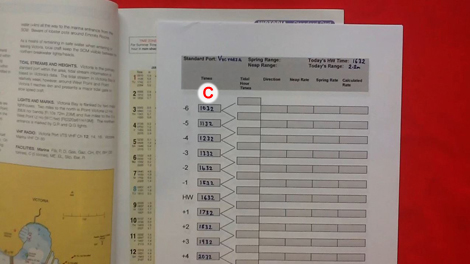
Now complete the times in the “times” column (point C) by simple adding hours as you move down the page.
Note: once you are used to this process you will realise you don’t need to complete the whole table ie. all of the times, just the ones you need.
The times in this first column correspond to the pages in the tidal stream atlas and the rows in the tidal diamond table.
For example, in this example, we now know 3 hours before high water is 1332 and to find the tidal stream at this time we either turn to the 3 hours before high water page in the atlas or look across the -3 row on the tidal diamond table.
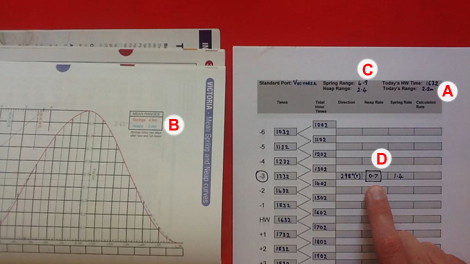
Now taking our example of 3 hours before high water we don’t just assume the tidal stream is flowing for that one minute (in this case 1332). We assume that the tidal stream is flowing in this direction and speed for one whole hour, 30 minutes either side of this time.
Therefore, we complete the second column (point D) with the times 30 minutes either side of the first column. These times in the second column are the limits of our tidal hours.
Using our example, we would expect the 3 hours before high water (1332) tidal stream to run between 1302 and 1402.
Let as assume we are making a passage between 1300 and 1400 on the day in question. From the table you can see that this is the tidal hour 3 hours before high water. To be precise the tidal hour is 1302 to 1402 but this is close enough.
We can then find the tidal information we need from the tidal diamond table or the tidal stream atlas. We write this information onto the table (point E).
Note: in reality the tidal stream does not suddenly change each hour however the stream shown in the tidal stream atlas and by using the tidal diamonds are averages and allow for easier calculations.
To see the whole method explained watch this video.
Video: skill
Calculating the tidal stream speed
We are almost there! So far we have found the tidal stream direction that we are interested in and the neap and spread rate (speed) of tide. We now need to calculate which of this rate we should use or whether we should use a rate somewhere in between.
In our example from above we first need to go to the tide table and find the range of the tide. That is the difference between the high water height of tide and low water height of tide at our standard port (Victoria in this case) on the particular day.
In this case the range was 2.2m (point A). We then turn to the tidal curve for our standard port and find the Spring and Neap ranges (point B). We write these on our sheet (point C).
In this case the spring range is 4.9m and neap range is 2.4m.
For the purposes of a quick answer (and Dayskipper) we can see that today’s range (2.2m) is very close to the neap range (2.4m). Therefore we will use the neap rate of 0.7kt (point D).
Therefore, when using this tidal stream to plot a Estimated Position or Course to Steer we will use:
– Direction: 298o(T)
– Rate: 0.7kt
In this second example, we are using the same standard port (Victoria) so the spring and neap ranges are the same (point E). However, as we are looking at a different day the range is different (point F) at 4.6m.
As 4.6m is close to the 4.9m spring range we will use the spring rate of tide, in this case 3.4kt (point G).
Therefore, when using this tidal stream to plot a Estimated Position or Course to Steer we will use:
– Direction: 128o(T)
– Rate: 3.4kt
In this third example, we can see we have a range of 3.7m (point H). This is somewhere in between the neap and spring ranges. We can confirm this by finding the mid-point of the neap and spring ranges (add the ranges and divide by two), this gives use 3.65m (point I).
As this range is closest to the mid-point of the spring and neap ranges we use the mid-point of the two tidal rates, again add them together and divide by 2 (point J).
Therefore, when using this tidal stream to plot a Estimated Position or Course to Steer we will use:
– Direction: 182o(T)
– Rate: 1.4kt
We have now run through the three possible cases for finding the tidal rate at Dayskipper level.
We are simply looking for you to identify whether the range for the day in question is closest to the spring, neap or mid-point range of the standard port. once you know this you can use either to spring, neap or mid-point of the tidal rates.
Tidal Stream – Spreadsheet
Use this spreadsheet to check your calculations to Dayskipper Tidal Stream questions. You can also use this to create and check questions of your own. Remember you will not be able to use this in the test.
To see the whole method explained watch this video.
Video: skill
Links
Tidal Streams
Learn how to calculate the tidal stream.
Progression
You can now use your knowledge of tidal streams to help you navigate. Either, Estimated Position (to find out where you are) or Course to Steer (to find out which way you need to go).
If you are doing the Yachtmaster course there is a more accurate way of calculating the Tidal Stream.
Feedback
The content of these pages is put together in good faith and is constantly evolving. It is possible that errors exist within this content. If you spot an error or would like to add anything to these pages please contact use via email.
Reading the content of these pages is not a substitute for completing a RYA Shorebased course or similar.

